Setting Up the Debugger
CodePerfect integrates with the Delve debugger, allowing you to debug your programs directly from inside CodePerfect.
Prerequisites
You'll need the Delve debugger. You can install the latest version from their docs.
Make sure Delve is installed correctly by opening a terminal and running
which dlv. If it's not able to find it, you
may need to update your PATH.
info
CodePerfect locates the dlv binary the same way. You don't need to configure
anything else — just run which dlv in bash, and make sure it prints out the right path.
Configuring the debugger
To get started, run Debug > Debug Profiles.
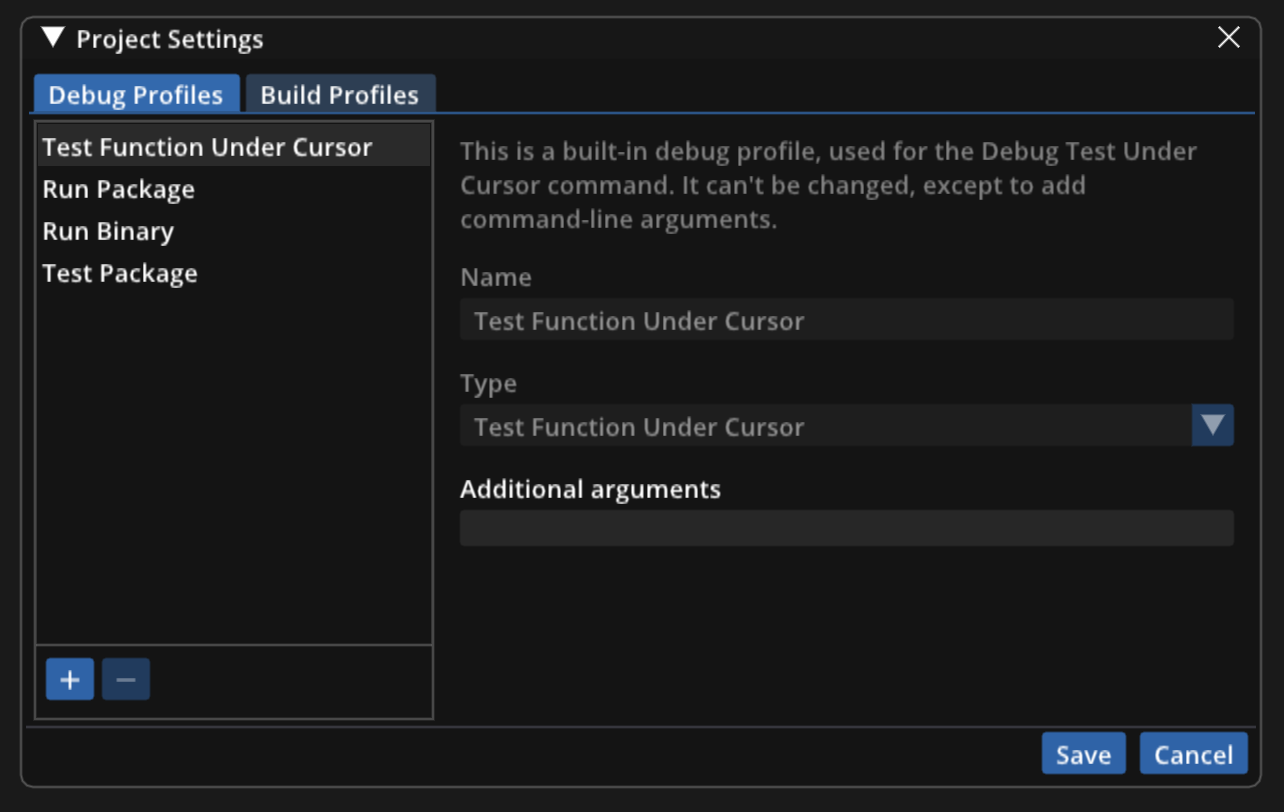
The list on the left lets you add, remove, and select profiles. Each profile is a piece of configuration that tells CodePerfect how to debug your program.
There are currently four supported profile types:
Test Function Under Cursor
This is used for the Test Function Under Cursor feature, which lets you debug an individual test. CodePerfect comes with a built-in profile of this type, which can't be removed, except to add command-line arguments. You can add additional profiles of this type.
The settings allow you to add command-line arguments.
Run Package
This profile lets you run and debug a
mainpackage.The settings allow you to either configure the package path, or to use whatever package the current file is located in. You can also add command-line arguments.
Run Binary
This profile lets you run and debug a binary built with
go build.The settings allow you to specify a path to the binary as well as extra command-line arguments.
Test Package
This profile lets you run and debug all the tests in a package.
The settings allow you to either configure the package path, or to just use whatever package the current file is located in.